An audiogram is a graph that represents the results of a hearing test. It shows you the softest sounds you can hear at different sound frequencies. Hearing test results plotted on audiograms indicate the type, degree, and pattern of hearing loss.
That's straightforward enough, but deciphering audiograms can be confusing. The key to interpreting them is understanding volume and sound frequencies, the two measurements used to determine hearing ability.
Why it matters
Tracking your hearing helps you gauge your hearing health so you can make well-informed decisions about when you should adopt hearing aids to preserve your social, physical, and psychological well-being.
- That's why we recommend annual hearing screenings for all adults.
- It's also why understanding audiograms makes discussions with your audiologist more helpful.
Two for hearing
Measuring sound volume and sound frequency determines the degree of hearing loss:
- Sound volume tells you how loud sounds must be before you can hear them. This is measured in decibels (dB).
- Sound frequency measures which sound frequencies are more difficult to hear. Sound frequencies are measured in Hertz (Hz). Hertz is the number of sound waves per second.

The audiogram grid
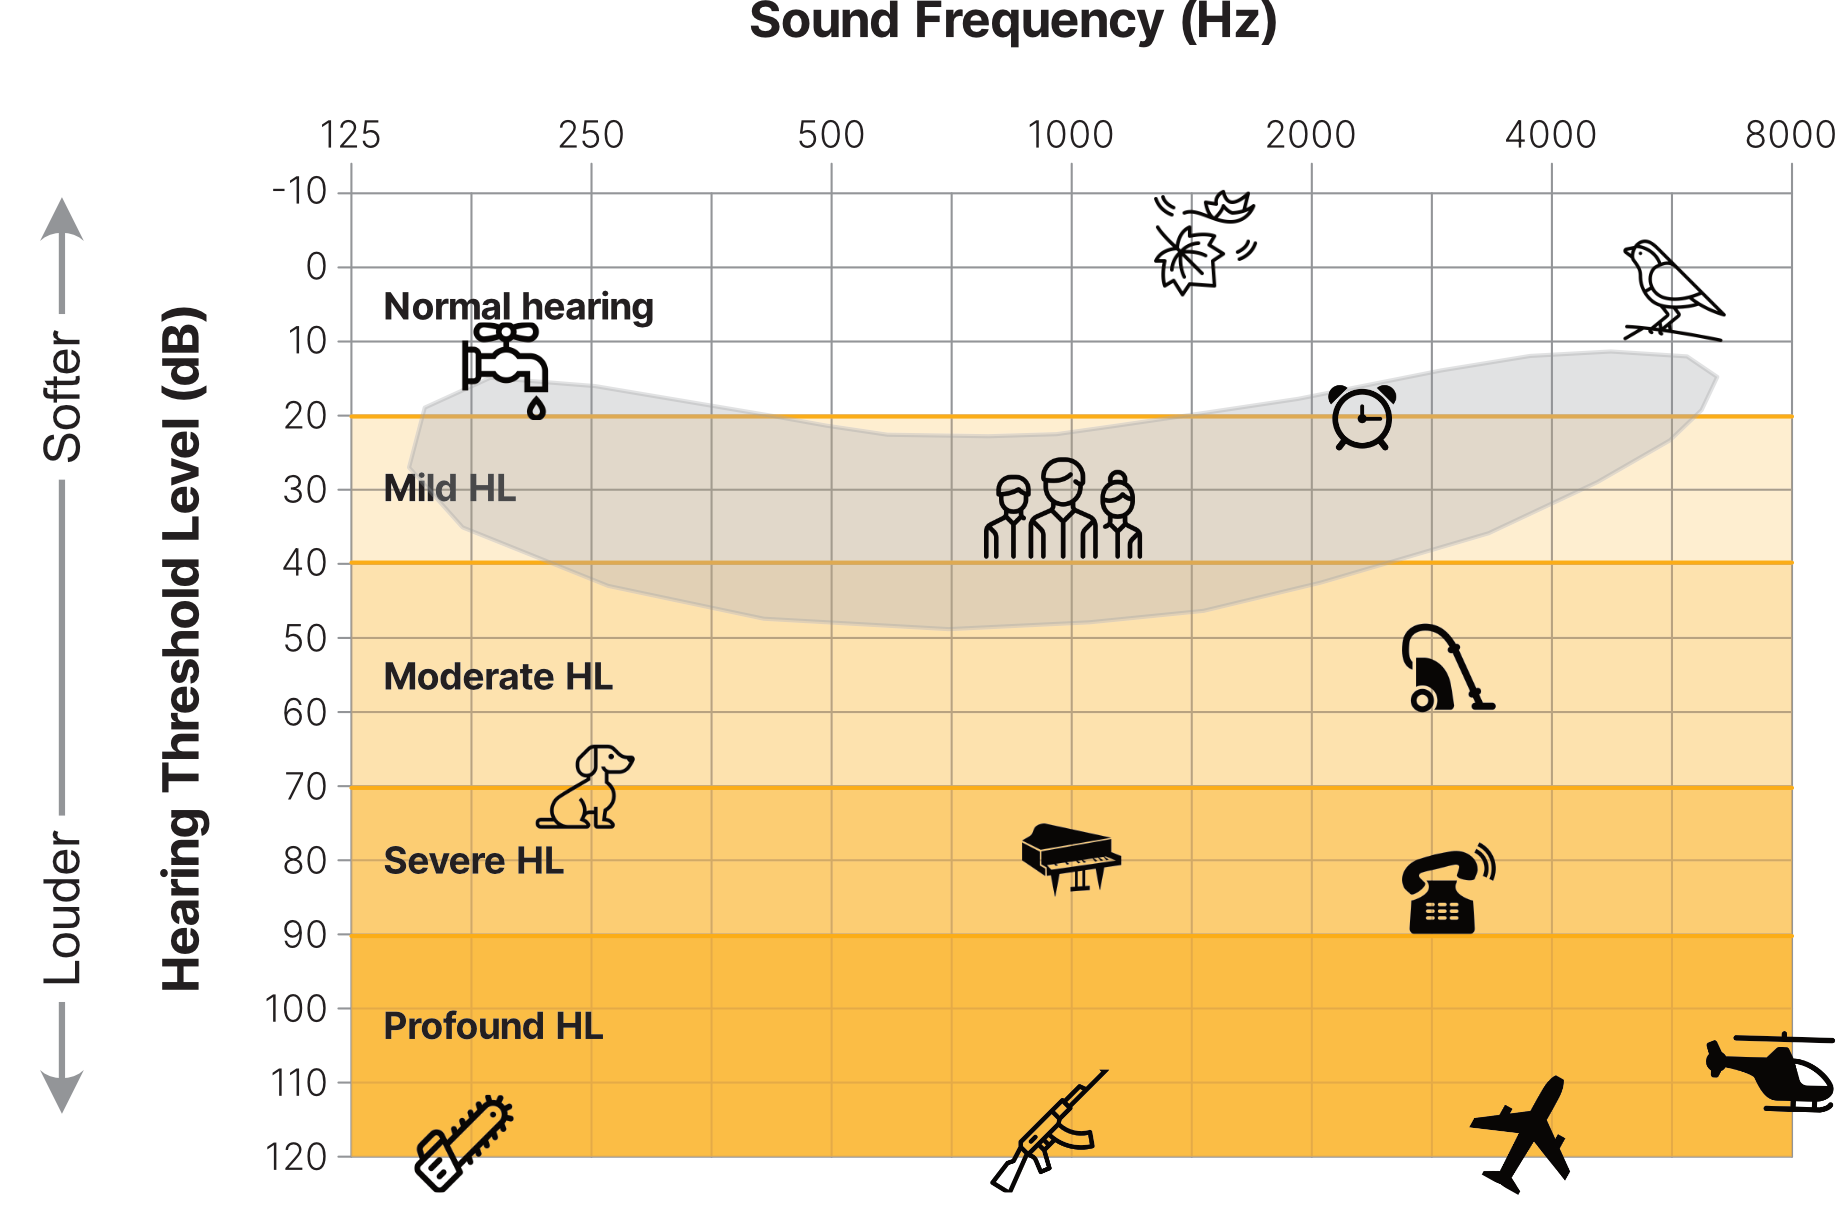
The graphic below shows you a blank audiogram labeled with normal hearing and the four categories of hearing loss. The vertical axis is Hearing Threshold Level (sound volume); the horizontal axis, sound frequency.

- Sound Frequency is represented by the vertical lines. Hearing tests typically measure hearing ability at frequencies ranging from 250 to 8000 Hz.
- The Hearing Threshold Level is the loudness of sound measured in decibels (dB), with the horizontal lines representing different volume levels.
- The higher the decibel level, the louder the sound (more sound energy).
Tip: On an audiogram, sound level (loudness) increases as you go down the Hearing Threshold Level (dB) axis, not up it. Test scores on this axis indicate how loud a sound must be before you can hear it (called hearing thresholds). Note the bidirectional vertical arrow on the far left side.
What sounds you can hear will vary by frequency. For example, you'll likely hear some sound frequencies at lower volumes and others at higher volumes.
Hearing loss classified
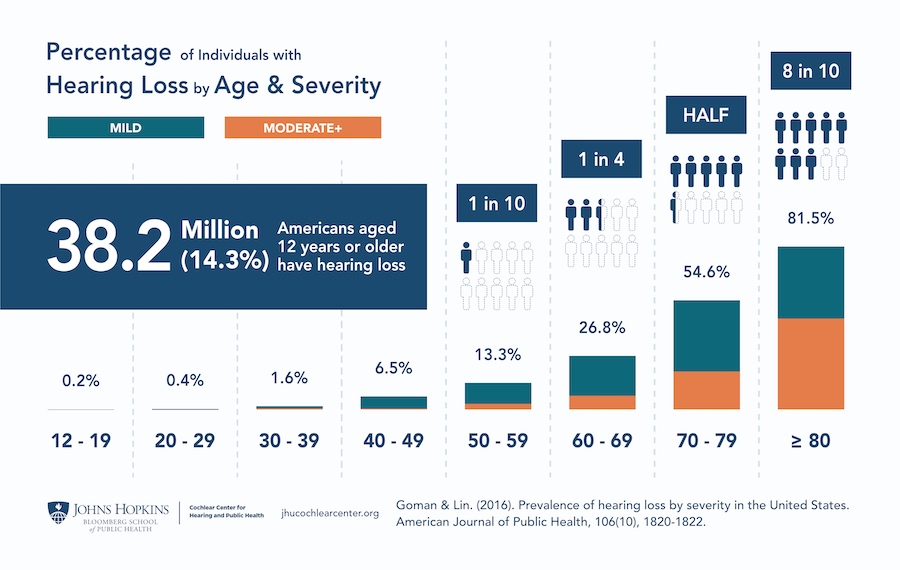
The hearing loss categories below also include the increased risk of dementia from hearing loss based on the research of Frank Lin, M.D., Ph.D. of Johns Hopkins Bloomberg School f Public Health.
- Mild hearing loss: You can understand conversational speech at this level, but some words become difficult to understand in noisy settings. Mild hearing loss is defined at up to 40 dB in the speech frequencies, encompassing a large portion of the speech banana.
- Moderate hearing loss: You're likely asking people to repeat themselves during in-person conversations and on the telephone. You cannot hear sounds lower than 40-69 db with moderate hearing loss.
- Severe hearing loss: A severe loss requires hearing aids to understand conversations. Reading lips to cope is expected, a skill people learn as hearing loss progresses. At this level of hearing loss, people cannot hear sounds lower than 70-94 dB.
- Profound hearing loss: People with this amount of hearing loss can only hear extremely loud conversations or sounds. Without hearing aids or cochlear implants, understanding what they hear is difficult. At this level of hearing loss, people cannot hear sounds lower than 95 dB.
Test results on an audiogram
The audiogram below shows the results of a hearing test.
- Note the grey banana-shaped element on the audiogram called the speech banana.
- The speech banana is important because it covers the frequencies and decibels needed to understand speech.
- It includes phonemes, the unique sounds of language that differentiate one word from another. For example, p, b, d, and t in the English words pad, pat, bad, and bat.
- Audiologists are primarily concerned with hearing loss within the speech banana because hearing loss in this range hinders communication and learning. It is especially consequential for children's language and speech development.

- The Xs and Os show the hearing thresholds for different sound frequencies for the left and right ears. The thresholds are not always the same at each frequency.
- Hearing thresholds are the softest sounds you could hear during your test at different sound frequencies.
- Examples:
- At 250 Hz, the right ear was just within the Normal hearing range with about 15 dB of hearing loss. The left ear results indicate 20 dB of hearing loss.
- At 1000 Hz, the results for the left ear remain the same, 20 dB of HL, whereas, the right ear has approximately 25 dB of HL.
Types of hearing loss revealed
By analyzing audiograms, audiologists can determine the extent and type of hearing loss, which guides their choice of therapies. For example —
-
Sensorineural Hearing Loss (SNHL) occurs when the inner ear or the central nervous system's auditory pathways are damaged. On an audiogram, SNHL is characterized by a loss of hearing at all frequencies, with the loss becoming more severe at higher frequencies, like the pattern of hearing loss in the audiogram above.
-
Conductive Hearing Loss (CHL) occurs in the external or middle ear, affecting sound transmission to the inner ear. On an audiogram, CHL is characterized by a loss of hearing ability at lower frequencies, which becomes less severe at higher frequencies.
-
Mixed Hearing Loss (MHL) combines sensorineural and conductive hearing loss. On an audiogram, MHL may show a loss of hearing ability at all frequencies, with the loss becoming more severe at lower frequencies.
Common sounds on an audiogram
To give you a better sense of context, the audiogram below shows you where various sounds align with sound volume and frequencies.
Soundcheck this
Sound intensity doubles for every increase of 3 dB because the decibel scale is logarithmic, not linear.
You'll see the impact of this doubling of intensity on unprotected ears in the examples below.
- Breathing: 10 dB.
- Typical conversation: 40-60 dB.
- Gas-powered lawnmower: 90 dB. This is 26 times more intense than a conversation at 50 dB.
- Rock concert: 120 dB. This is 47 times more intense than a conversation at 50 dB. Noise this loud is uncomfortable.
- Gunshot: 140 dB. This is 60 times more intense than a conversation held at 50 dB. Sounds reaching 140 dB are painful.
Quick sidebar: Noise-induced hearing loss results from your ears being exposed to sound 85 dB and louder for prolonged periods without protection.
- How do I know if noise is 85 dB or more? If you must shout to talk to someone only three feet away, the noise level is greater than 85 decibels. It's time to put hearing protection on.
The takeaway
When comparing audiograms from previous tests, pay attention to the following changes:
-
Threshold shifts: Look for any significant changes in hearing thresholds at specific frequencies. A threshold shift of 20 dB or more between two audiograms is considered clinically significant.
-
Age-related hearing loss: As you age, your hearing thresholds may gradually increase.
-
Tinnitus: If you experience persistent tinnitus, it may be associated with a higher risk of hearing threshold elevation over time, even for people with clinically normal hearing.
-
Noise exposure: If you are exposed to loud noise at work, your hearing test results should be adjusted to account for natural hearing loss due to aging.
Always consult with an audiologist or speech-language pathologist to discuss changes in your audiogram. They will explain the consequences and provide recommendations for managing your hearing health.
How's your hearing health?
Check yours with a free, 15-minute hearing screening by an audiologist.
Hearing loss is gradual and not benign. Untreated, it increases your risk of social isolation, falling, and dementia.
Call 708-599-9500 to schedule yours.
► For facts about hearing loss and hearing aid options, download The Hearing Loss Guide.
Don't let untreated hearing loss threaten your health and happiness.

